How to create custom metrics for EC2 Servers using Cloudwatch Agent
Creating and custom metrics for ec2 servers using amazon-cloudwatch-agent

I'm a tech aficionado, and cloud & DevOps engineer. I love solving problems and collaborating with teams. #TechEnthusiast #CloudOps #AWS #DevOps #TeamPlayer Connect with me to stay updated with my latest articles and insights on AWS, Linux, and DevOps!
If you are using ec2 servers for your production workload, you'll need to monitor multiple server parameters like CPU utilization, Memory Utilization, Storage, etc. You can monitor these parameters using Cloudwatch metrics. But, does Cloudwatch have every metrics that we require? Well, the answer to the question is No. So if that's the case, how can we create our own metrics for our servers? There are multiple ways to do this, you can use shell scripts with aws cli, a third-party agent, or you can use aws recommended amazon-cloudwatch-agent. In this tutorial, we will only focus on amazon-cloudwatch-agent and we will be performing actions on amazon-Linux 2 OS.
Installing amazon-cloudwatch-agent
To install amazon-cloudwatch-agent in your ec2 server, you can use the following command :
sudo yum install amazon-cloudwatch-agent
If you are using OS other than Amazon Linux, then refer to this documentation. It will be installed in /opt/aws/amazon-cloudwatch-watch.
After you have successfully installed the agent, now it's time to configure it.
Configuring the agent
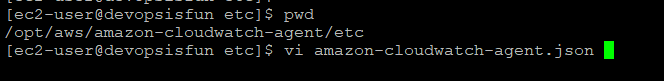
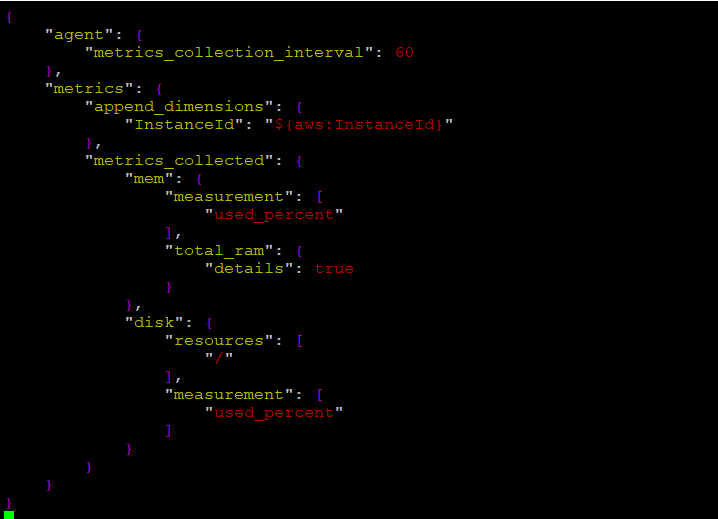
amazon-cloudwatch-agent uses JSON format for its config file. The path to the config is /opt/aws/amazon-cloudwatch-agent/etc. Here you need to create a JSON file named amazon-cloudwatch-agent.json.
Let's understand this config.
In the "agent" block, we have set the metrics collection interval to 60 seconds.
In the "metrics" block, we have set the dimensions to be appended with the cloudwatch metrics.
In the "metrics_collected" block, we have given what metrics we want to collect using amazon-cloudwatch-agent. For this example, I have taken only disk usage and memory usage metrics, but you can take any metrics that you want. You can refer to this page for the available metrics that you can push using this agent.
Once you are done with this config, you have to enable and start the amazon-cloudwatch-agent.service.

Once you start the service, you can see these metrics on your aws cloudwatch metrics page :


Conclusion
In this tutorial, we have learned to push custom metrics to cloudwatch for monitoring. Now you can set alerts for these metrics, or you can add these metrics to your cloudwatch dashboard, it is totally up to you and your use case.
I am open to feedback, so feel free to comment for feedback or queries.
Also, Follow me on LinkedIn and subscribe to our newsletter.


